The purpose of this alert is to analyze early voting trends for the 2018 election in North Carolina. The focus is solely on turnout and should not be utilized as a predictor of any specific races.
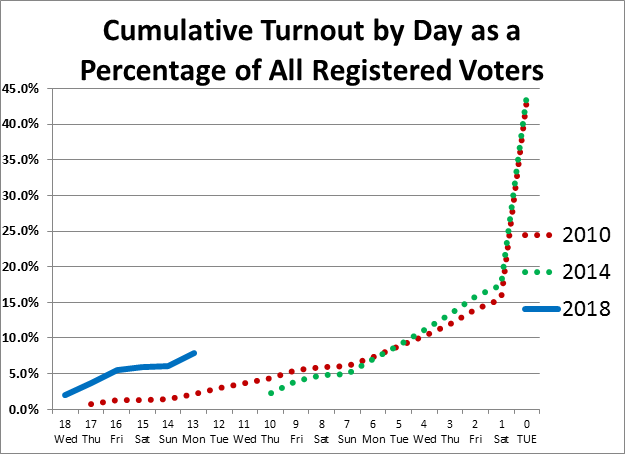
Through Monday, October 22, the sixth day of early voting in North Carolina, more than 560,000 people – 8 percent of registered voters – have voted in person. Another 100,000 voters have returned their absentee mail ballots. How does this compare to previous election cycles? That question is a little more complicated this year as we had one more day at the beginning of one-stop early voting than we did in 2016, so we will compare through the same day (Monday, two weeks prior to Election Day) and then compare versus the same number of one-stop voting days.
Through Monday, two weeks from Election Day:
2014: NA
2016: 579,845
2018: 560,866 (-3% vs. 2016)
Through the first six days of early voting:
2014: 560,806
2016: 738,323
2018: 560,866 (virtual tie compared to 2014)
Analysts are commenting that North Carolina’s 2018 early voting turnout looks more like a presidential election year than previous midterm elections. As you can see from the numbers above, that is true if you compare through the same day (Monday, two weeks from Election Day), but not if you compare the same number of overall early voting days. The extra day at the beginning of early voting boosts the 2018 numbers.
Thus, it is too early to determine if we are looking at an overall spike in turnout this year compared to 2014 or other midterms. Indeed, if you count the number of early voting days, 2018 is almost exactly tied with 2014 in terms of total votes – and down if you look at percentage turnout, as North Carolina has grown in population since 2014. Signs are currently pointing to a normal midterm election turnout in the range of 38 to 45 percent. The turnout through the rest of this week will narrow the range.
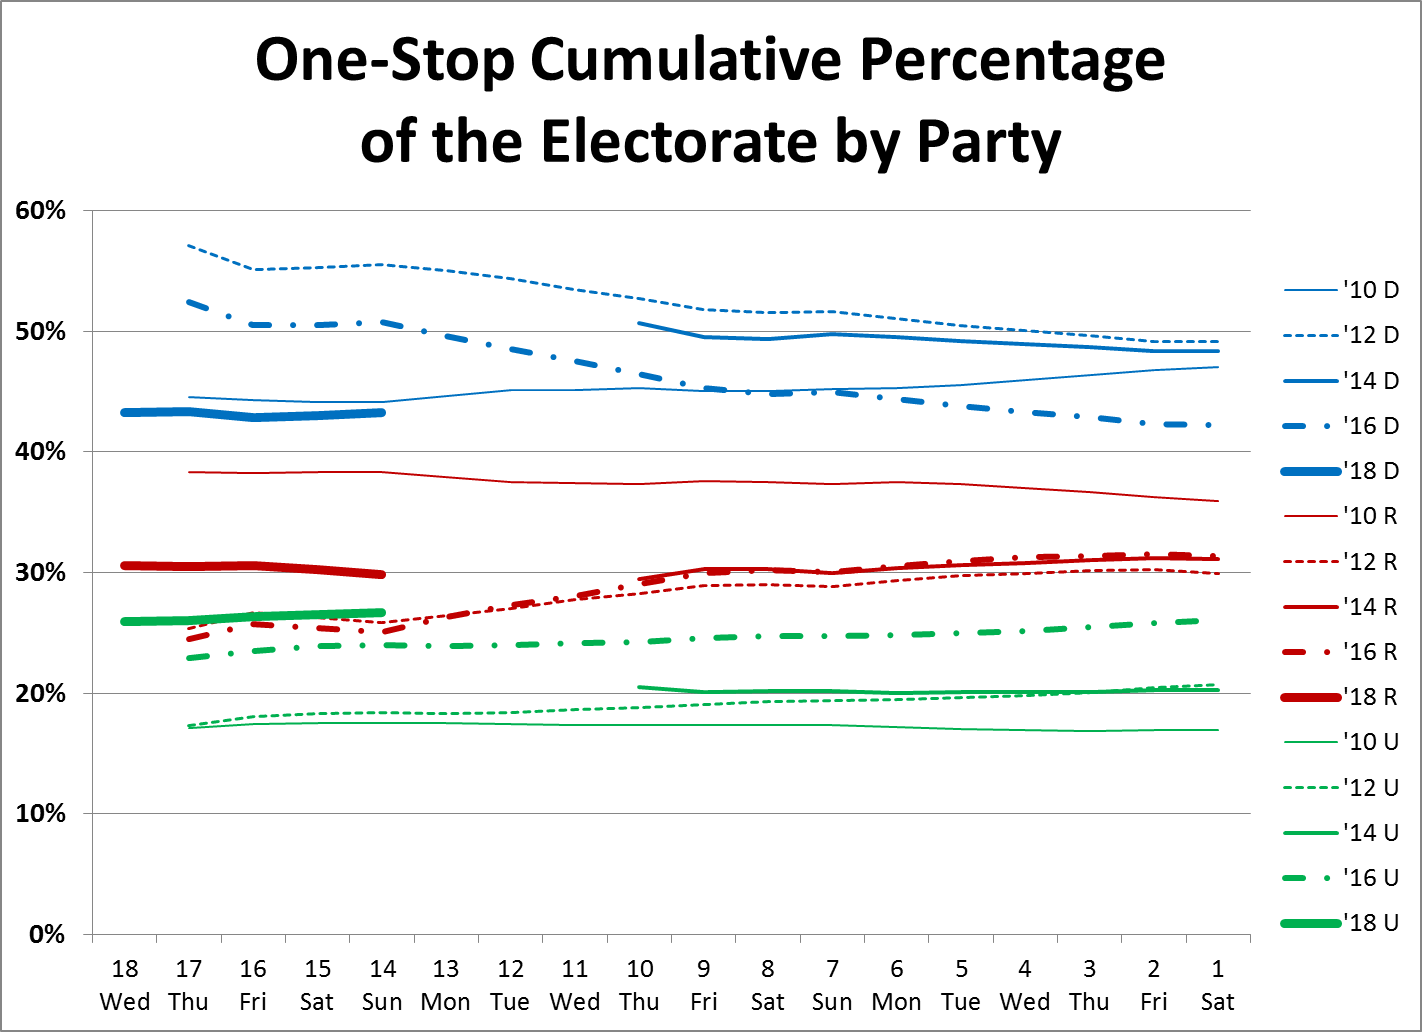
While it is still too early to get a sense of what overall turnout in 2018 might be, we can get a sense of what the makeup of the electorate looks like thus far compared to previous years. Again, we will break this down through the same day (Monday, two weeks prior to Election Day) and then against the same number of early voting days.
Through Monday, two weeks from Election Day:
2014: NA
2016: 49.6% Democrat, 26.3% Republican, 23.9% Unaffiliated
2018: 43.3% Democrat, 30.0% Republican, 26.4% Unaffiliated
Through the first six days of early voting:
2014: 49.2% Democrat, 30.6% Republican, 20.0% Unaffiliated
2016: 48.5% Democrat, 27.3% Republican, 24.0% Unaffiliated
2018: 43.3% Democrat, 30.0% Republican, 26.4% Unaffiliated
So far, 2018 has a much higher percentage of unaffiliated voters casting ballots during early voting compared to 2014 (and even 2016, a presidential year) – and a lower percentage of Democrats. Republicans are up compared to this point in 2016, but they on par with 2014 if you look at the same number of early voting days. We are still early in the process, but so far the turnout numbers look better for Republicans statewide than Democrats.
Will that trend change? If you look at previous elections, the day-to-day trends for Democrats, Republicans, and unaffiliated voters are remarkably consistent. Democrats begin early voting with their largest percentage of the overall electorate, gradually decreasing until Election Day, when Republicans have their largest percentage of the electorate. The graph below shows how the different years compare. If history is any guide to how the electorate will change through 2018 early voting, Democrats will trend downward from 43 percent and Republicans and unaffiliated voters will trend slightly upward from 30 percent and 26 percent, respectively.
With two weeks of early voting remaining, much can change. We will continue to send out updates monitoring the trends on how 2018 is shaping up. For additional information, please contact us or your regular Parker Poe contact.