The purpose of this alert is to analyze early voting trends for the 2018 election in North Carolina. The focus is solely on turnout and should not be utilized as a predictor of any specific races.
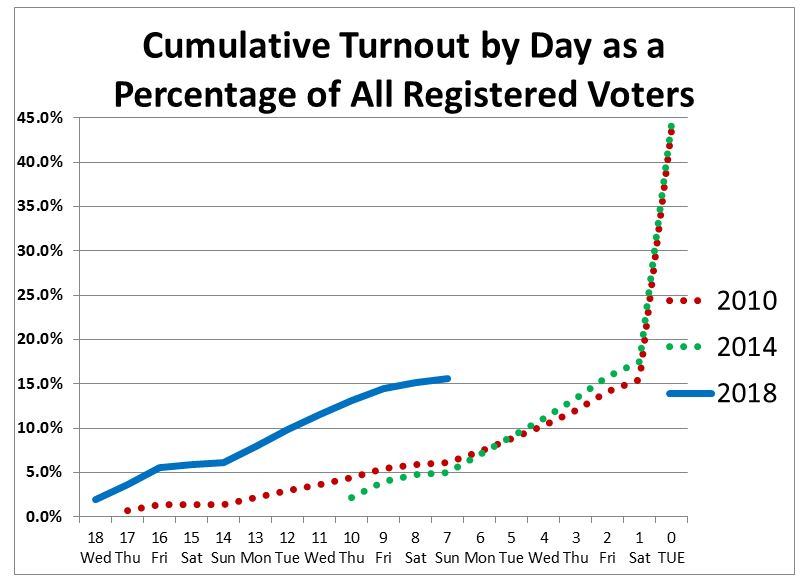
Through Sunday, October 28, the 12th day of early voting in North Carolina, more than 1.2 million people – 17 percent of registered voters – have now voted by mail or in person, surpassing the final early voting totals in 2014 with a full week to go. The pace has fallen off presidential levels now, as expected, but it is readily apparent that early voting turnout will far surpass all previous midterms.
With 12 days of data for in-person ballots, we are getting a clearer picture of one-stop turnout and how the voter mix is different thus far in this election cycle than previous ones.
Through Sunday, nine days from Election Day:
2014: 298,662
2016: 1,546,528
2018: 1,100,804 (269% increase over 2014, which had fewer days of early voting)
Last week we noted that total turnout would likely be in the range of 38 to 45 percent. With 17 percent turnout already, and a full week of early voting to go, it is hard to imagine turnout not eclipsing 45 percent. Remember, 2014 saw a high-profile U.S. Senate race – the most expensive in American history up to that point – and turnout fell just short of 45 percent. This year there are no high-profile races, yet turnout is not dropping off.
Here is the turnout mix thus far for in-person early voting compared to 2014 and 2016:
Through Sunday, nine days from Election Day:
2014: 49.8% Democrat, 29.9% Republican, 20.2% Unaffiliated
2016: 44.9% Democrat, 30.1% Republican, 24.8% Unaffiliated
2018: 42.9% Democrat, 30.2% Republican, 26.6% Unaffiliated
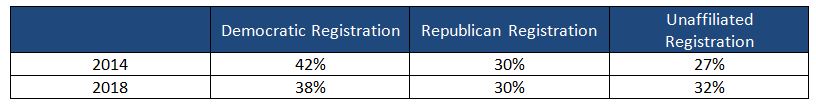
Compared to 2014, there is a much higher percentage of unaffiliated voters (+6.4), slightly more Republicans (+0.3), and far fewer Democrats (-6.9). The reason for this is not as simple as Democrats not turning out to vote at the same pace. In fact, Democrats have actually matched turnout compared to 2014 already when you measure the percentage of registered Democrats who have cast ballots (20 percent). However, there are now fewer registered Democrats.
Below is a comparison of voter registration percentages for 2014 and 2018. These registration shifts explain why Democratic vote share is lagging, despite turnout (the percentage of Democratic voters casting ballots) on pace with 2014.
This next chart compares vote share by party registration for 2014, 2016, and 2018:
.JPG)
You may notice that Democratic vote share in previous election cycles decreased as early voting reached its conclusion on the Saturday before Election Day. Correspondingly, Republican and unaffiliated vote share increased. That has not been the case thus far in 2018. The vote share levels have remained almost flat. This is good news for Democrats, as early turnout numbers looked abysmal, comparatively, but have improved daily as compared to 2014 and 2016 … by simply remaining flat.
We will prepare our final summary of early voting next Monday and look at what we might expect for Election Day turnout. Until then, please contact us or your regular Parker Poe contact for additional information.